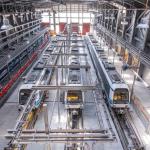
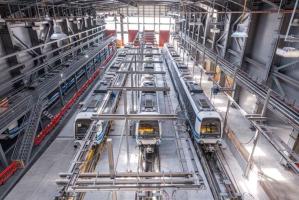
Thessaloniki gets ready for its metro launch in November
The underground rapid transit lines have been under construction for almost two decades due to various project delays
The underground rapid transit lines have been under construction for almost two decades due to various project delays

The cross pinnacle on the Tower of Jesus Christ will be ready to receive visitors in 2026 on the centennial of Gaudi’s death

Now you can get your wine in Talence by paying directly in Bitcoin

That’s because the state has to spend money on updating the railway infrastructure rather than subsidizing the cost of the popular pass

Steffen Romstöck said that he would respect the residents’ choice and would take over the helm of the municipality, even if he didn’t run

The measure, which will come into force from 1 January 2025, will be partial and temporary…for now

Rethinking renewable energy sources for the urban landscape

But operating them is still illegal under the country’s legislation

The examples, compiled by Beyond Fossil Fuels, can inform and inspire communities and entrepreneurs that still feel trepidation at the prospect of energy transition
Now you can get your wine in Talence by paying directly in Bitcoin
Rethinking renewable energy sources for the urban landscape
The examples, compiled by Beyond Fossil Fuels, can inform and inspire communities and entrepreneurs that still feel trepidation at the prospect of energy transition
The underground rapid transit lines have been under construction for almost two decades due to various project delays

Plus, it has a unique modular design that allows it to be shortened and lengthened like a train

At least, that’s the promise made by the mayor of Paris, Anne Hidalgo

Despite its church-y name, the district has long been known as the hangout spot for the artsy crowds
At least, that’s the promise made by the mayor of Paris, Anne Hidalgo

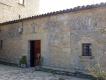
Hostal de Pinós is located in the geographical centre of the autonomous region

On the eve of the new academic year, the ranking considers several distinct but essential factors


Following a successful trial phase, these quiet areas will now be available on all main routes in the country

The academic institution shows a deeper understanding of the well-being of its students


These examples from the peak COVID era show us how the interpretation of facts can also generate disinfo
Very often when we hear about statistics we think of credibility, truthfulness, and original research. Usually, the statistics are compiled by professionals in this field. However, such a factual tool can still be skilfully used to achieve controversial goals or produce misinformation and disinformation. In the early months of the Covid pandemic, this statement was particularly evident.
How can statistics be used to influence decisions improperly? Well, that largely depends on how we interpret them.
In an article for Forbes magazine from 2020, Dr Robert Pearl points out that there are at least three ways that statistics, related to coronavirus might be misleading.
Take for example the statistics related to the confirmed cases of Covid 19. When working with numbers one must be careful because when you hear confirmed cases it does not automatically mean that this describes the complete spread of the infection - there are many people who have been infected and contagious but have not been tested. That is, the number can vary continuously.
A second example is the number of tests done. To what extent do they even indicate that the pandemic is under control? Based on the evidence provided by the author, it turns out that the tests done couldn’t prove the pandemic was under control.
When it comes to the many tests done daily, several questions arose. Did the tests done show that the mass situation was under control at that moment? And were the tests themselves reliable at all?
Apparently, it was not reliable, because no matter how many people you test daily, this is still not a guarantee for mastering the situation. For one, their effectiveness was not 100%, and in addition, it took up to a week, at the time, for results to be confirmed during which period a contagious person could unknowingly infect others. Statistics were thus, at best, a precarious and incomplete snapshot of reality.
In third place, there was the question of the fatality of cases with Covid 19. Perhaps this was the most important thing to pay attention to because such statistics could seriously influence public perception of the new disease. To date, it is known that the case fatality rate compared to the number of infected represents a fairly small ratio.
This statement in no way belittles the number of deaths, but the point is different. That is, if one chooses to point out to the mass audience only the number of those who have died from Covid 19, without providing any reference points and comparisons, then the information itself could confusion and anxiety.
It can therefore be concluded that when we focus on only one aspect of something from a given statistic report, we shouldn’t assume that it shows the whole picture. This could be a fertile ground for misinformation generation. And if we interpret any given information according to our desires and goals, then this would also produce intentional disinformation, or at the very least, a debatable truth.
This article is part of Read Twice – an EU-funded project, coordinated by Euro Advance Association that targets young people and aims to counter disinformation and fake news by enhancing their skills to assess critically information, identify vicious and harmful media content and distinguish between facts and opinions, thus improving their media literacy competences.
The contents of this publication are the sole responsibility of its author and do not necessarily reflect the opinion of the European Union.
The underground rapid transit lines have been under construction for almost two decades due to various project delays

Now you can get your wine in Talence by paying directly in Bitcoin

That’s because the state has to spend money on updating the railway infrastructure rather than subsidizing the cost of the popular pass

Rethinking renewable energy sources for the urban landscape

The examples, compiled by Beyond Fossil Fuels, can inform and inspire communities and entrepreneurs that still feel trepidation at the prospect of energy transition
Now you can get your wine in Talence by paying directly in Bitcoin

The 10th European Conference on Sustainable Cities and Towns (ESCT) sets the stage for stronger cooperation between the EU, national and local level to fast track Europe's transition to climate neutrality.

At least, that’s the promise made by the mayor of Paris, Anne Hidalgo
The underground rapid transit lines have been under construction for almost two decades due to various project delays
At least, that’s the promise made by the mayor of Paris, Anne Hidalgo
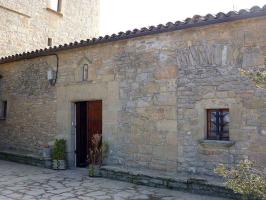
Hostal de Pinós is located in the geographical centre of the autonomous region
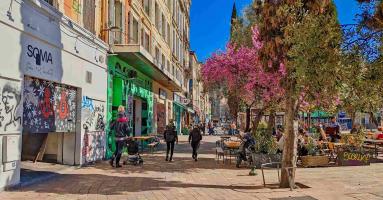
Despite its church-y name, the district has long been known as the hangout spot for the artsy crowds
Urban dwellers across the EU are having a say in making their surroundings friendlier to people and the environment.

Forests in the EU can help green the European construction industry and bolster a continent-wide push for architectural improvements.

Apply by 10 November and do your part for the transformation of European public spaces
An interview with the Mayor of a Polish city that seeks to reinvent itself
An interview with the newly elected ICLEI President and Mayor of Malmö
A conversation with the Mayor of Lisbon about the spirit and dimensions of innovation present in the Portuguese capital