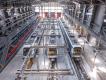
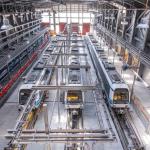
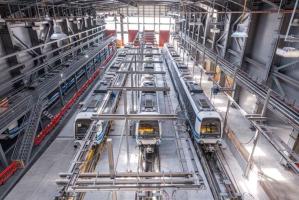
Thessaloniki gets ready for its metro launch in November
The underground rapid transit lines have been under construction for almost two decades due to various project delays
The underground rapid transit lines have been under construction for almost two decades due to various project delays
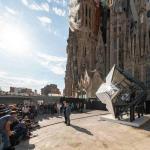
The cross pinnacle on the Tower of Jesus Christ will be ready to receive visitors in 2026 on the centennial of Gaudi’s death

Now you can get your wine in Talence by paying directly in Bitcoin

That’s because the state has to spend money on updating the railway infrastructure rather than subsidizing the cost of the popular pass

Steffen Romstöck said that he would respect the residents’ choice and would take over the helm of the municipality, even if he didn’t run
The measure, which will come into force from 1 January 2025, will be partial and temporary…for now
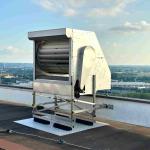
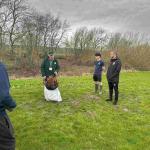
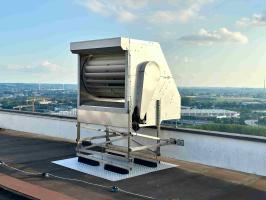
Rethinking renewable energy sources for the urban landscape

But operating them is still illegal under the country’s legislation
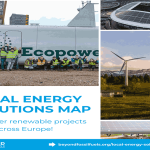
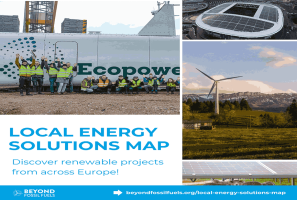
The examples, compiled by Beyond Fossil Fuels, can inform and inspire communities and entrepreneurs that still feel trepidation at the prospect of energy transition
Now you can get your wine in Talence by paying directly in Bitcoin
Rethinking renewable energy sources for the urban landscape
The examples, compiled by Beyond Fossil Fuels, can inform and inspire communities and entrepreneurs that still feel trepidation at the prospect of energy transition
The underground rapid transit lines have been under construction for almost two decades due to various project delays

Plus, it has a unique modular design that allows it to be shortened and lengthened like a train

At least, that’s the promise made by the mayor of Paris, Anne Hidalgo
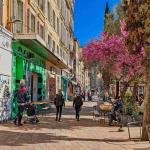
Despite its church-y name, the district has long been known as the hangout spot for the artsy crowds
At least, that’s the promise made by the mayor of Paris, Anne Hidalgo
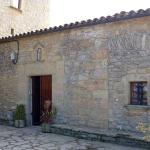
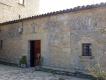
Hostal de Pinós is located in the geographical centre of the autonomous region

On the eve of the new academic year, the ranking considers several distinct but essential factors

Following a successful trial phase, these quiet areas will now be available on all main routes in the country

The academic institution shows a deeper understanding of the well-being of its students


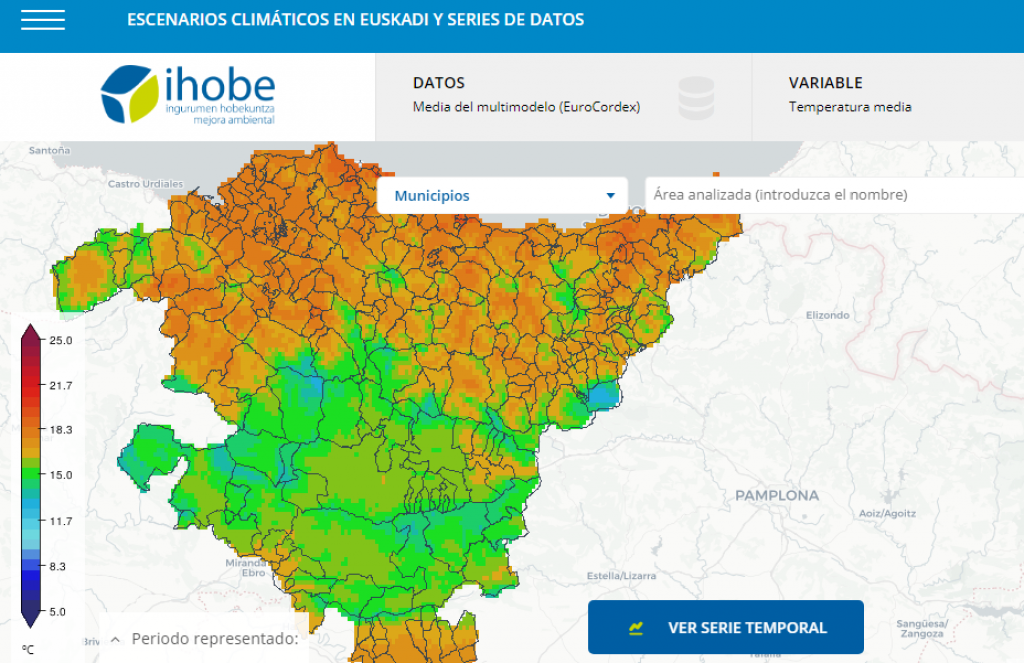
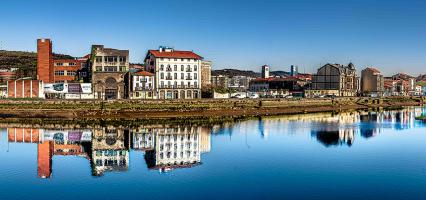
Climate change scenarios Basque country, Source: Visualizing climate change scenarios for the Basque country / IHOBE
What will be the temperature in your neighbourhood in 2100? See the projections.
Climate change is one of the most urgent and complex environmental challenges of our lifetimes and we must give it our full attention, recognizes the Basque Country's Climate Change Strategy, Klima2050. The strategic document sets the objective of ensuring the resilience of the Spanish autonomous community in the years ahead. In order to do this properly, it needs relevant and what is more - open data.
The Strategy adopted by the Basque Government foresees the need to anticipate the risks of climate change, through innovation, improvement and knowledge transfer. That is why IHOBE (Public Society of Environmental Management of the Basque Government) has developed a tool allowing for the visualization of different scenarios for the climate transformation in Euskadi.
The regional climate scenarios constitute a reference and cross-sectional information for future studies of the impact of climate change on the various sectors, such as health, agriculture, water resources, the natural environment, etc. They aim to help identify the best adaptation measures to climate change.
The models have conveniently been summarized into an online tool which allows testing climate change scenarios from different time perspectives – historical (1971-2000), near future (2011-2040), medium future (2041-2070) and distant future (2071-2100). The visual tool is freely accessible and will certainly be of use to public administrations, researchers and ordinary citizens.
Global circulation models (GCM-General Circulation Models) are the main tools for the analysis of climate change and its impact on different socio-economic sectors. The scenarios, offered in the form of a map at high spatial resolution (1 km x 1km), are available until 2100 with daily data. They take into account variables such as temperature and precipitation.
Finally, visitors can analyse and extract information by searching in one of 17 specific areas – municipality, neighbourhood, agricultural areas, etc. Time data series are available for download by year or by season, either in annual averages or daily data.
So, if you are curious to see how the Basque country’s temperature is expected to change over time (hint: it goes into dark red), make sure to check out the tool.
The underground rapid transit lines have been under construction for almost two decades due to various project delays

Now you can get your wine in Talence by paying directly in Bitcoin

That’s because the state has to spend money on updating the railway infrastructure rather than subsidizing the cost of the popular pass
Rethinking renewable energy sources for the urban landscape
The examples, compiled by Beyond Fossil Fuels, can inform and inspire communities and entrepreneurs that still feel trepidation at the prospect of energy transition
Now you can get your wine in Talence by paying directly in Bitcoin
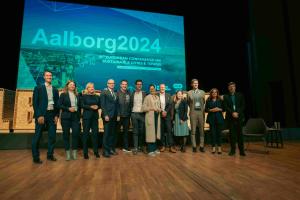
The 10th European Conference on Sustainable Cities and Towns (ESCT) sets the stage for stronger cooperation between the EU, national and local level to fast track Europe's transition to climate neutrality.

At least, that’s the promise made by the mayor of Paris, Anne Hidalgo
The underground rapid transit lines have been under construction for almost two decades due to various project delays
At least, that’s the promise made by the mayor of Paris, Anne Hidalgo
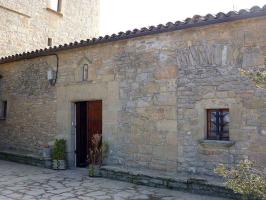
Hostal de Pinós is located in the geographical centre of the autonomous region
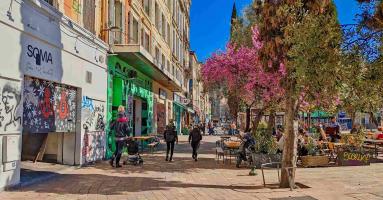
Despite its church-y name, the district has long been known as the hangout spot for the artsy crowds
Urban dwellers across the EU are having a say in making their surroundings friendlier to people and the environment.
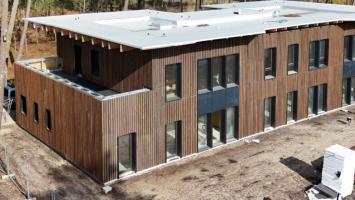
Forests in the EU can help green the European construction industry and bolster a continent-wide push for architectural improvements.

Apply by 10 November and do your part for the transformation of European public spaces
An interview with the Mayor of a Polish city that seeks to reinvent itself
An interview with the newly elected ICLEI President and Mayor of Malmö
A conversation with the Mayor of Lisbon about the spirit and dimensions of innovation present in the Portuguese capital